
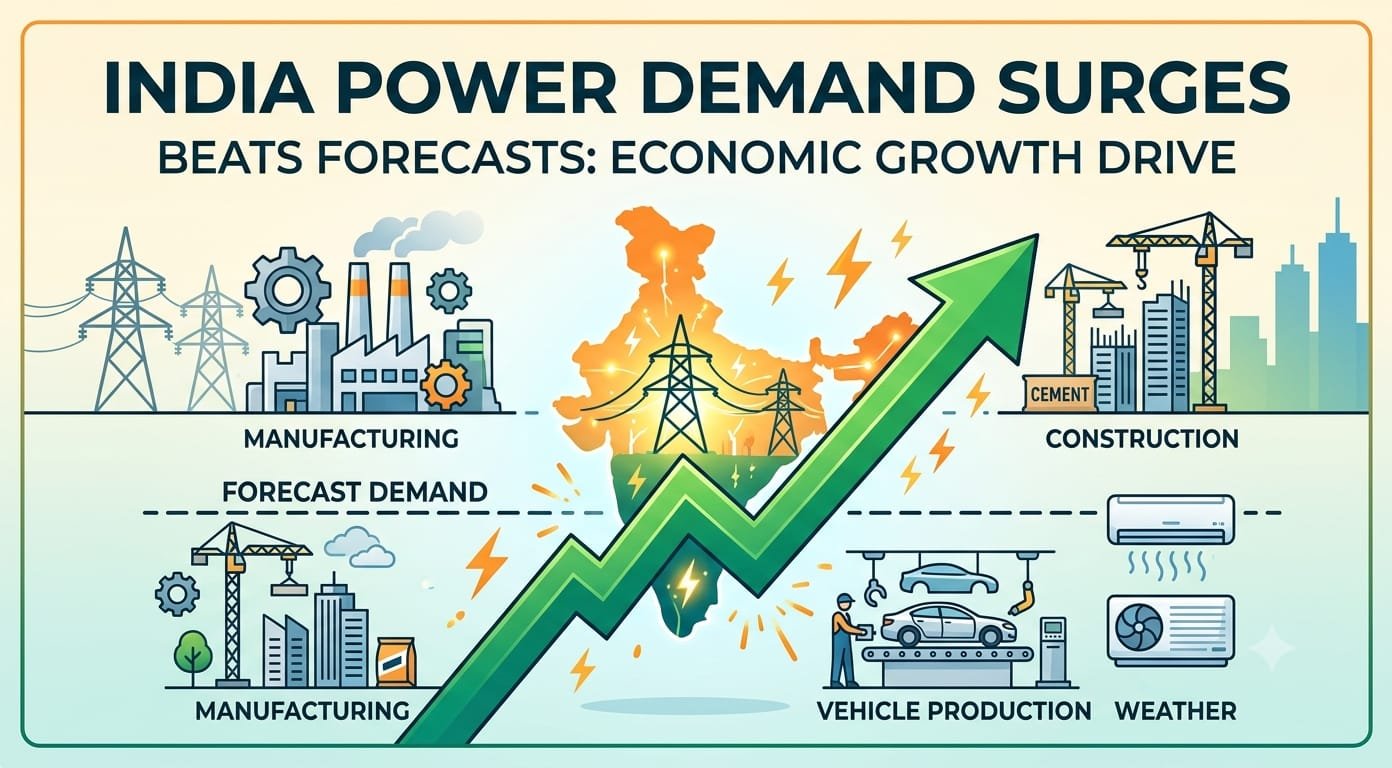
India’s electricity demand growing 3.3% more than the government’s projection between April and August is largely an encouraging signal for the economy. Normally, actual power requirement remains below the short-term forecast prepared by the Central Electricity Authority.
This time, however, demand stayed consistently higher for five months, showing that households, factories, businesses and infrastructure activity needed more electricity than expected.
The main immediate reason was weather: deficient rainfall and persistently high temperatures increased the use of cooling appliances, while lower hydropower availability added pressure on the power system. Yet, beyond weather, the trend also reflects stronger underlying economic activity, especially in manufacturing, construction and transport-related sectors.
When power demand is higher than expected, it generally means that more machines are running, more factories are producing, more construction work is happening and more commercial establishments are operating. Electricity is a real-time indicator because it cannot be stored easily on a large scale; therefore, rising consumption often captures economic momentum quickly.
In this case, the higher demand was not only a seasonal effect. Industrial data also supports the view that production activity improved during the period. India’s Index of Industrial Production grew 6.7% during April–August, compared with 4.2% in the same period last year. This clear improvement suggests that factories and infrastructure-linked industries were using more power to raise output.
The comparison with the previous year becomes stronger when quarterly performance is considered. Manufacturing gross value added grew 7.72% in the first quarter and 9.13% in the second quarter of FY 2025-26, showing that industrial momentum strengthened as the year progressed. This matters because manufacturing is the largest component of industrial production and a major user of electricity.
A faster-growing manufacturing sector naturally increases demand for power through machinery, lighting, cooling, processing and logistics. The rise in electricity and gas supply output, which grew 12.3% in August, also confirms that the power sector was responding to higher consumption.
Sector-wise data gives a clearer picture of where the additional electricity demand may have come from. The automobile sector was one of the biggest contributors to industrial growth. Production of motor vehicles, trailers and semi-trailers rose 25.2% in August, supported by strong performance in auto components, spare parts, passenger cars and commercial vehicles.
More vehicle production means more electricity-intensive activity in assembly lines, painting, welding, testing and component manufacturing. It also indicates improving demand in the transport economy, which can further support fuel, logistics and employment.
Cement is another important sector linked closely with power demand. Cement output recorded strong growth of 12.5% in August, after rising 12.7% in July. Cement production requires substantial energy for grinding, clinker production and transportation.
Higher cement output usually points to more construction activity, such as housing, roads, factories, commercial buildings and infrastructure projects. Since construction activity also increases demand for steel, bricks, sand, transport and machinery, rising cement production can create a wider chain of electricity consumption across the economy.
The overall core sector also performed better than last year. Cumulative growth of the eight core industries rose to 4.3% during April–August, compared with 2.4% in the same period a year earlier. Electricity and cement showed particularly strong growth, while sectors such as steel and coal also supported industrial activity.
This broad-based improvement suggests that the higher power demand was not coming from one isolated area. Instead, it appears to have been supported by manufacturing, construction materials, energy production and transport-related industries together.
At the same time, the power-supply side faced challenges. Coal-based plants generated nearly 10% more electricity during April–August than in the same period last year, producing 579,869.38 million units against 527,542.87 million units earlier. Hydropower generation, however, fell by more than 11% because weak rainfall reduced water availability in reservoirs.
Since hydropower is important for meeting evening peak demand, its decline made coal-based generation more important. This also led to lower coal stocks at thermal plants, which is why the government asked captive coal-based plants to operate at higher capacity from October to December.
Overall, the 3.3% excess power demand can be seen as a positive reflection of India’s expanding economic activity, stronger industrial output, higher vehicle production and robust cement demand. Weather and low hydropower generation clearly intensified the pressure, but the improvement in IIP, manufacturing and core-sector output shows that real economic demand also played an important role.
If rainfall improves and hydropower generation recovers, the gap between actual demand and projections is expected to narrow in the coming months. Until then, the trend highlights the need for careful coal stocking, better renewable-energy integration and stronger grid planning, while also confirming that India’s growth engine is becoming more power-hungry in a productive way.

